
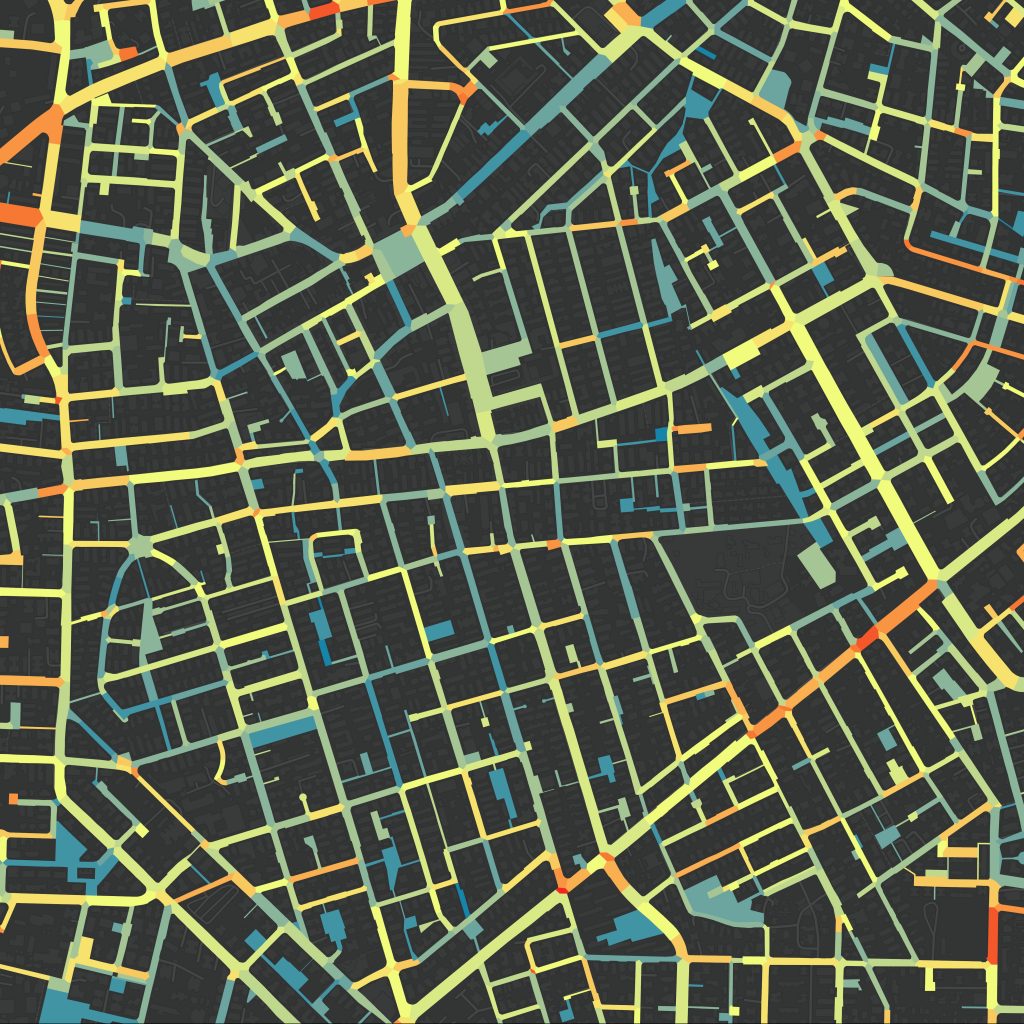
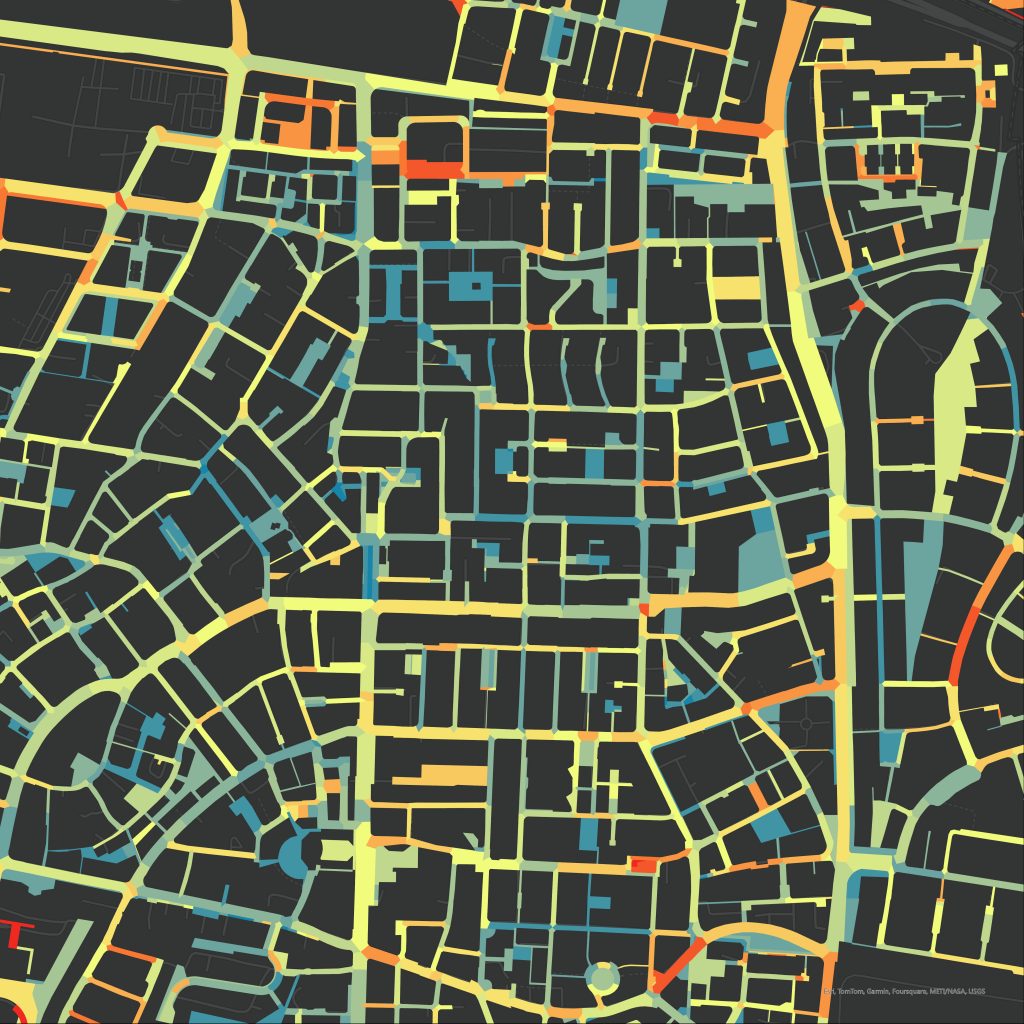
Since 2017, I have been working on the development and application of high-resolution urban shade mapping for assisting decision-makers in prioritizing urban actions. The concept of “shade maps” is simple: shade maps should visually inform users about street-level shade availability during summer, taking into account shade cast by buildings and trees. In places where summer heat stress is substantially exacerbated by exposure to solar radiation, shade maps effectively reveal high-resolution microclimatic weak spots, as well as significantly cool outdoor locations.
Shade maps can show the amount of shade for a certain time. Yet, for a better understanding of the cumulative effect of urban design on shade availability, shade maps use a daily Shade Index, which quantifies the proportion of solar radiation intercepted before reaching ground level during a typical summer day. The higher the Shade Index (between 0 and 1), the higher the shade provided by the design of an urban setting. Shade Index values can be calculated for any given area, though the shade maps I have produced focus on shade quantification in street segments and neighbourhoods.
Shade maps help understand the hierarchy of shade assets within a city and their allocation in different parts of the city. Combined with tree maps, they can also expose the dependence of outdoor shade on tree canopy cover and tree allocation, thus supporting planners with an evidence-based tool for allocating resources for improving shading conditions where they are most needed.
Until now, we have created highly detailed shade maps for almost 20 cities, many of which have been in use to produce strategic plans for shading and urban forestry and to inform their execution. You can access some of them by clicking the map thumbnails below.
For more information on the way shade maps are produced and used, click here.
The comprehensive set of shade maps and tree maps I developed for Tel Aviv-Yafo Municipality in 2019 can be accessed here. A similar interactive map interface for the city of Beer Sheva can be accessed here.
The Guidelines for Applying Quantitative Shade Indicators in Urban Planning in Israel can be downloaded by clicking here.
You can also download the Grasshopper code Kikayon, used to quickly quantify shading levels of different street designs, from: Kikayon: a computational tool for interactive evaluation of street shading.


More information on our work on urban shade and tree mapping can be found in the following publications:
- Or Aleksandrowicz, Shachar Zur, Yonatan Lebendiger, Yoav Lerman, Shade maps for climatically-aware urban design in Tel Aviv-Yafo, The 1st Regional Conference of the Cyprus Network for Urban Morphology (CyNUM), Nicosia, Cyprus, 16-18 May 2018.
- Or Aleksandrowicz, Shachar Zur, Yonatan Lebendiger, Yoav Lerman, Shade Maps and their Application for Shade Conservation and Intensification in Tel Aviv-Yafo [in Hebrew], Tel Aviv-Yafo Municipality, 2019.
- Or Aleksandrowicz, Shachar Zur, Yonatan Lebendiger and Yoav Lerman, Shade maps for prioritizing municipal microclimatic action in hot climates: Learning from Tel Aviv-Yafo, Sustainable Cities and Society 53: 101931, 2020, DOI: 10.1016/j.scs.2019.101931.
- Or Aleksandrowicz, Mapping and management of urban shade assets: a novel approach for promoting climatic urban action, in Ansar Khan et al. (eds.), Global Urban Heat Island Mitigation, Elsevier, Amsterdam, 2022, pp. 1-27.
- Anna Shnaidman, Or Aleksandrowicz, Dariel Renn-Pony, Moshe Yaniv, Medad Hoze and Morel Weisthal, Geo data-based policymaking: National Tree Canopy Cover Example, FIG Working Week 2023, 28 May–1 June 2023.
- Or Aleksandrowicz and Ezra Ozery, A Parametric Tool for Outdoor Shade Design: Harnessing Quantitative Indices and Visual Feedback for Effective and Efficient Climatic Design of Streets, Proceedings of CAAD Futures 2023: Computer-Aided Architectural Design. INTERCONNECTIONS: Co-computing Beyond Boundaries, 2023.
- Or Aleksandrowicz, Daniel Rosenberg and David Pearlmutter, Prioritising Street Shade Intensification to Support Pedestrian Accessibility to Public Transport: A Data-driven Approach, Tehnicki glasnik/Technical Journal 18(si1), 2024.
- Or Aleksandrowicz, Daniel Rosenberg and David Pearlmutter, Securing climatic accessibility to public transport? A data-driven approach to urban shading operations [in Hebrew], submitted to the Environment and Sustainability Research Center, The Open University of Israel, 2024.
- Or Aleksandrowicz, Shade maps, theory and practice: the basis of efficient and effective heat adaptation actions in cities, EGU General Assembly 2025, Vienna, Austria, 27 April-2 May 2025.
- Or Aleksandrowicz, Naama Shapira, Michelle C. Levenson, Shachar Zur and David Pearlmutter, Guidelines for Applying Quantitative Shade Indicators in Urban Planning in Israel, Derech Tzel and Yad Hanadiv, 2025.