2024-2026
Funding agency: Israel’s Ministry of Energy and Infrastructure
Primary Researchers: Or Aleksandrowicz, Avigdor Gal
Project Researchers: Omri Savir, Gilad Kutiel
Heating and cooling buildings account for about 30% of Israel’s national electricity consumption, and 96.5% of Israeli households now have air conditioning. Yet the data currently used to forecast national demand do not capture how consumption responds to local climate, short-term heat events, building characteristics, or the behaviour of different populations. Urban building energy models have rarely been validated against large real-world datasets, mostly because researchers rarely get access to high-resolution consumption data. This study used large-scale smart-meter data to measure how weather, building characteristics, and user populations shape residential electricity demand. It also aimed to develop models that predict this demand at high spatial and temporal resolution, from the single building up to the national grid.
The study had two parts. Part I analysed 15-minute smart-meter readings from the Israel Electric Corporation, aggregated per building. They covered residential buildings in seven cities (Ashdod, Beer Sheva, Hadera, Modiin, Netanya, Rishon LeZion, and Rosh Ha’ayin) in 2023 and 2024, with up to 22,050 buildings and 343,181 meters per year. We linked consumption to hourly Heat Index values from the Israel Meteorological Service, building geometry derived from Survey of Israel data, and the socio-economic cluster of each building’s statistical area. From each building’s consumption time series, we extracted 782 statistical features, then used them to classify buildings and group them into consumption types. We built cross-building prediction models (linear regression and Explainable Boosting Machine) that predict consumption in buildings not seen during training. We also built per-building Prophet models that forecast summer consumption two months ahead from weather alone, tested with both observed and forecast weather.
Part II dealt with national day-ahead demand forecasting. Assuming under-predicting demand typically costs 5–20 times more than over-predicting it, we trained a compact neural network with asymmetric (pinball) loss functions. For this, we used three years of 5-minute national demand data from the system operator Noga (March 2023 – February 2026) and weather data from three Israel Meteorological Service stations. We compared it with an identical model trained with a symmetric loss and post-hoc cost calibration, as well as Noga’s published day-ahead forecasts.
Main findings
Residential consumption closely follows heat stress: the correlation between daily Heat Index and consumption was r = 0.75. Summer consumption averaged 1.86 times that of the transition seasons. Weekend consumption averaged 12–17% higher than on weekdays, and on Fridays it peaked at midday rather than in the evening.
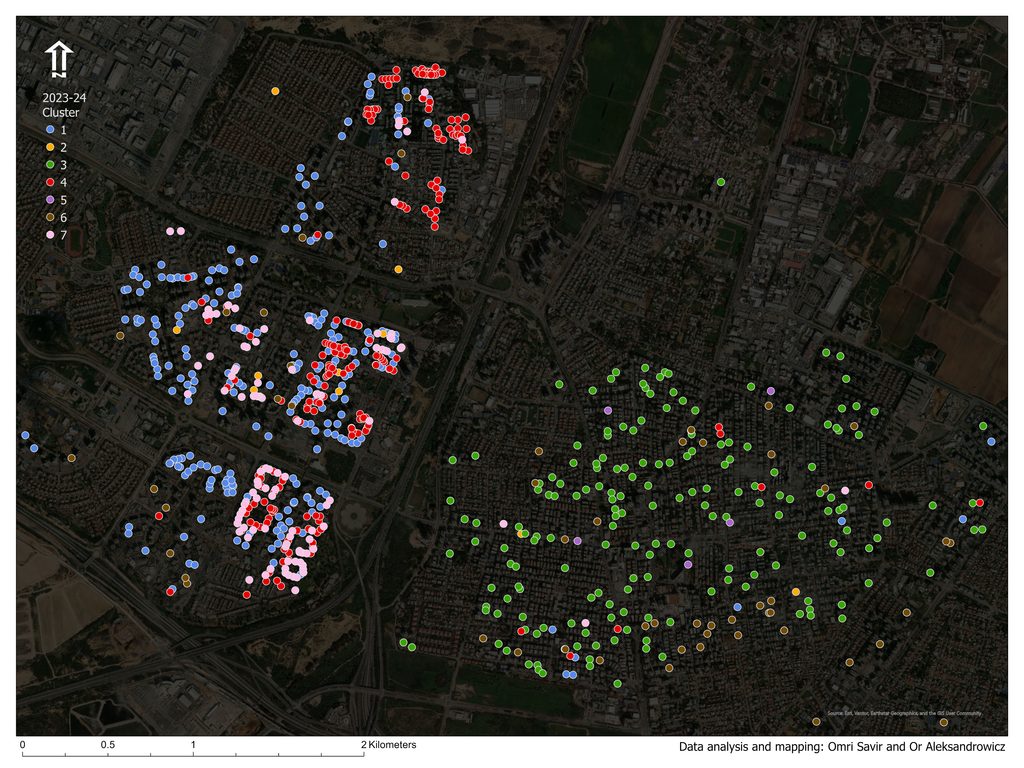
Consumption patterns differed clearly between cities and population groups. A building’s consumption “fingerprint” alone identified its city with a weighted F1 score of 0.75–0.79, and identified its neighbourhood’s socio-economic cluster less well. Clustering produced seven “construction–consumption” types, three of which cover about 75% of buildings. These types were only partly stable: about half of the buildings that clustered together in 2023 remained together in 2024. Demographics seemed to matter more than construction. Buildings in low socio-economic, mostly ultra-Orthodox neighbourhoods used about as much electricity as buildings in affluent areas.
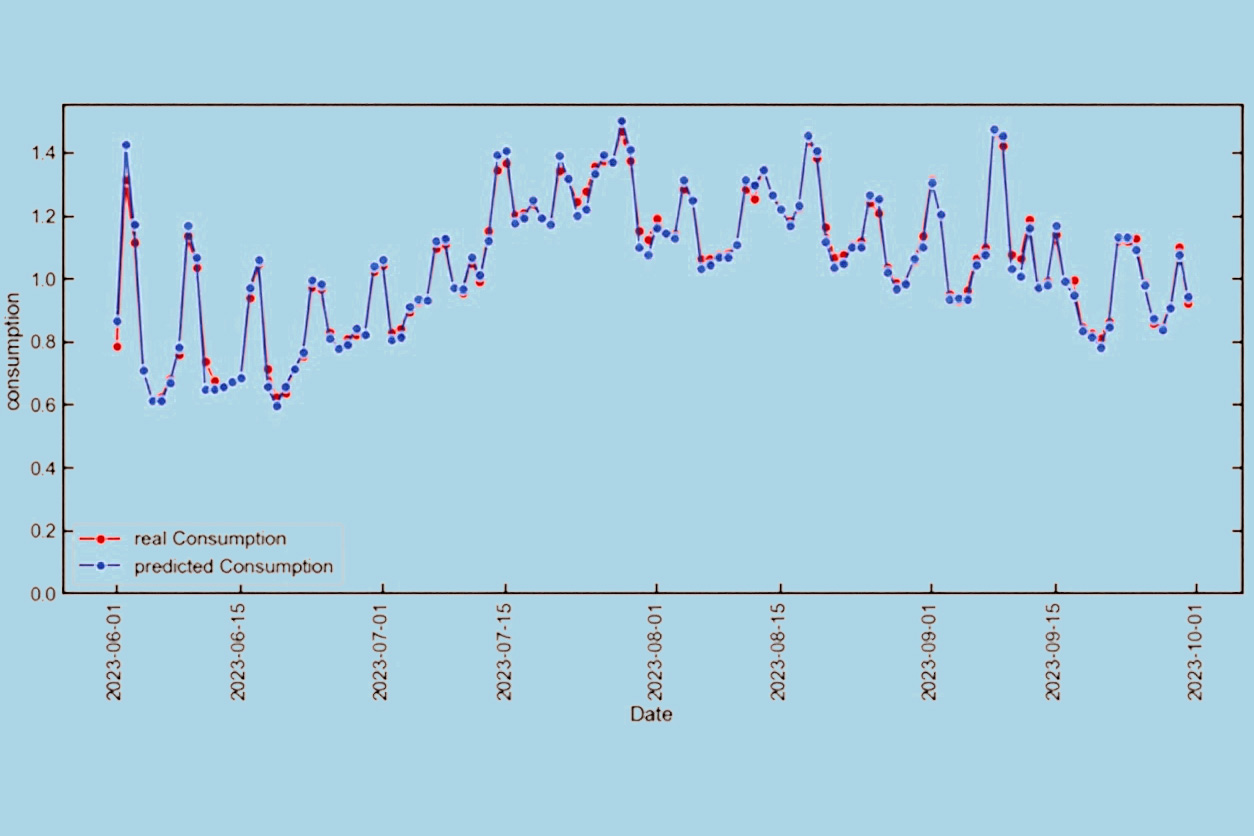
The cross-building models reached city-level R² of 0.98–0.995 and building-level R² of 0.46–0.74. Once we included consumption history and the Heat Index, basic building characteristics (floor area, number of floors) added almost nothing. Prophet forecasts reached city-level R² of 0.79–0.97 in all but one city-year. Replacing observed weather with weather forecasts reduced accuracy only slightly when the models were trained on forecasts.
In Part II, asymmetric training cut expected procurement cost by 40% at a 5:1 cost ratio and by 73% at 20:1, compared with symmetric training. Post-hoc calibration narrowed this gap but did not close it: the asymmetric models still cost 8% and 18% less. Noga’s forecast is accurate (R² ≈ 0.98) but essentially unbiased, so it is not cost-optimal when costs are asymmetric.
Conclusions and recommendations
Accessible data (consumption history and the Heat Index) can support accurate, interpretable demand models at the building, city, and national levels without detailed physical building data. We recommend that system operators and market participants train and evaluate forecasts on cost-sensitive metrics, not symmetric error alone, and that market rules require reporting these metrics. Importantly, the analysed buildings were not a representative sample of the national building stock. Therefore, as smart-meter coverage grows, we recommend creating a representative multi-year dataset linked to building and demographic data. This will enable year-round and heatwave-specific forecasting, prediction for buildings with no consumption history (such as planned neighbourhoods), and national-scale calibration of urban building energy models to support energy planning.
The research report can be downloaded here.